PRIORITY AREA
1. Climate leadership


Aspiration to 2030
Through demonstration of its operations, the University has catalysed ambitious climate action by others.
Progress against targets
The University is certified carbon neutral by 2025.
A comprehensive greenhouse gas inventory (GHGI) for 2022 has set the baseline for carbon emission reduction actions to achieve this target
The University has achieved climate positive status by 2030.
This will follow achievement of 2025 carbon neutral target (above)
-
With COVID-19 lockdowns coming to an end, our students and staff returned to campus in 2022, resulting in a 6 per cent increase in energy consumption in terms of purchased electricity, on-site electricity generation, natural gas and LPG consumption. Despite this, our energy use remained below 2019 levels. We purchased 67 GWh of electricity through our Power Purchase Agreements with the Murra Warra and Crowlands wind farms.
Our Smart Campus Energy Upgrades program continued in 2022. We invested approximately $6 million in LED lighting and chiller upgrades, on-site solar PV installations, and heating, ventilation and air conditioning optimisation. These projects are expected to result in a saving of approximately 3.8 GWh per annum of electricity, enough to power around 820 homes for a year.


Energy consumption by source

MWh
= megawatt
hour
1MWh
= 1000 kWh
kWh
= kilowatt
hour
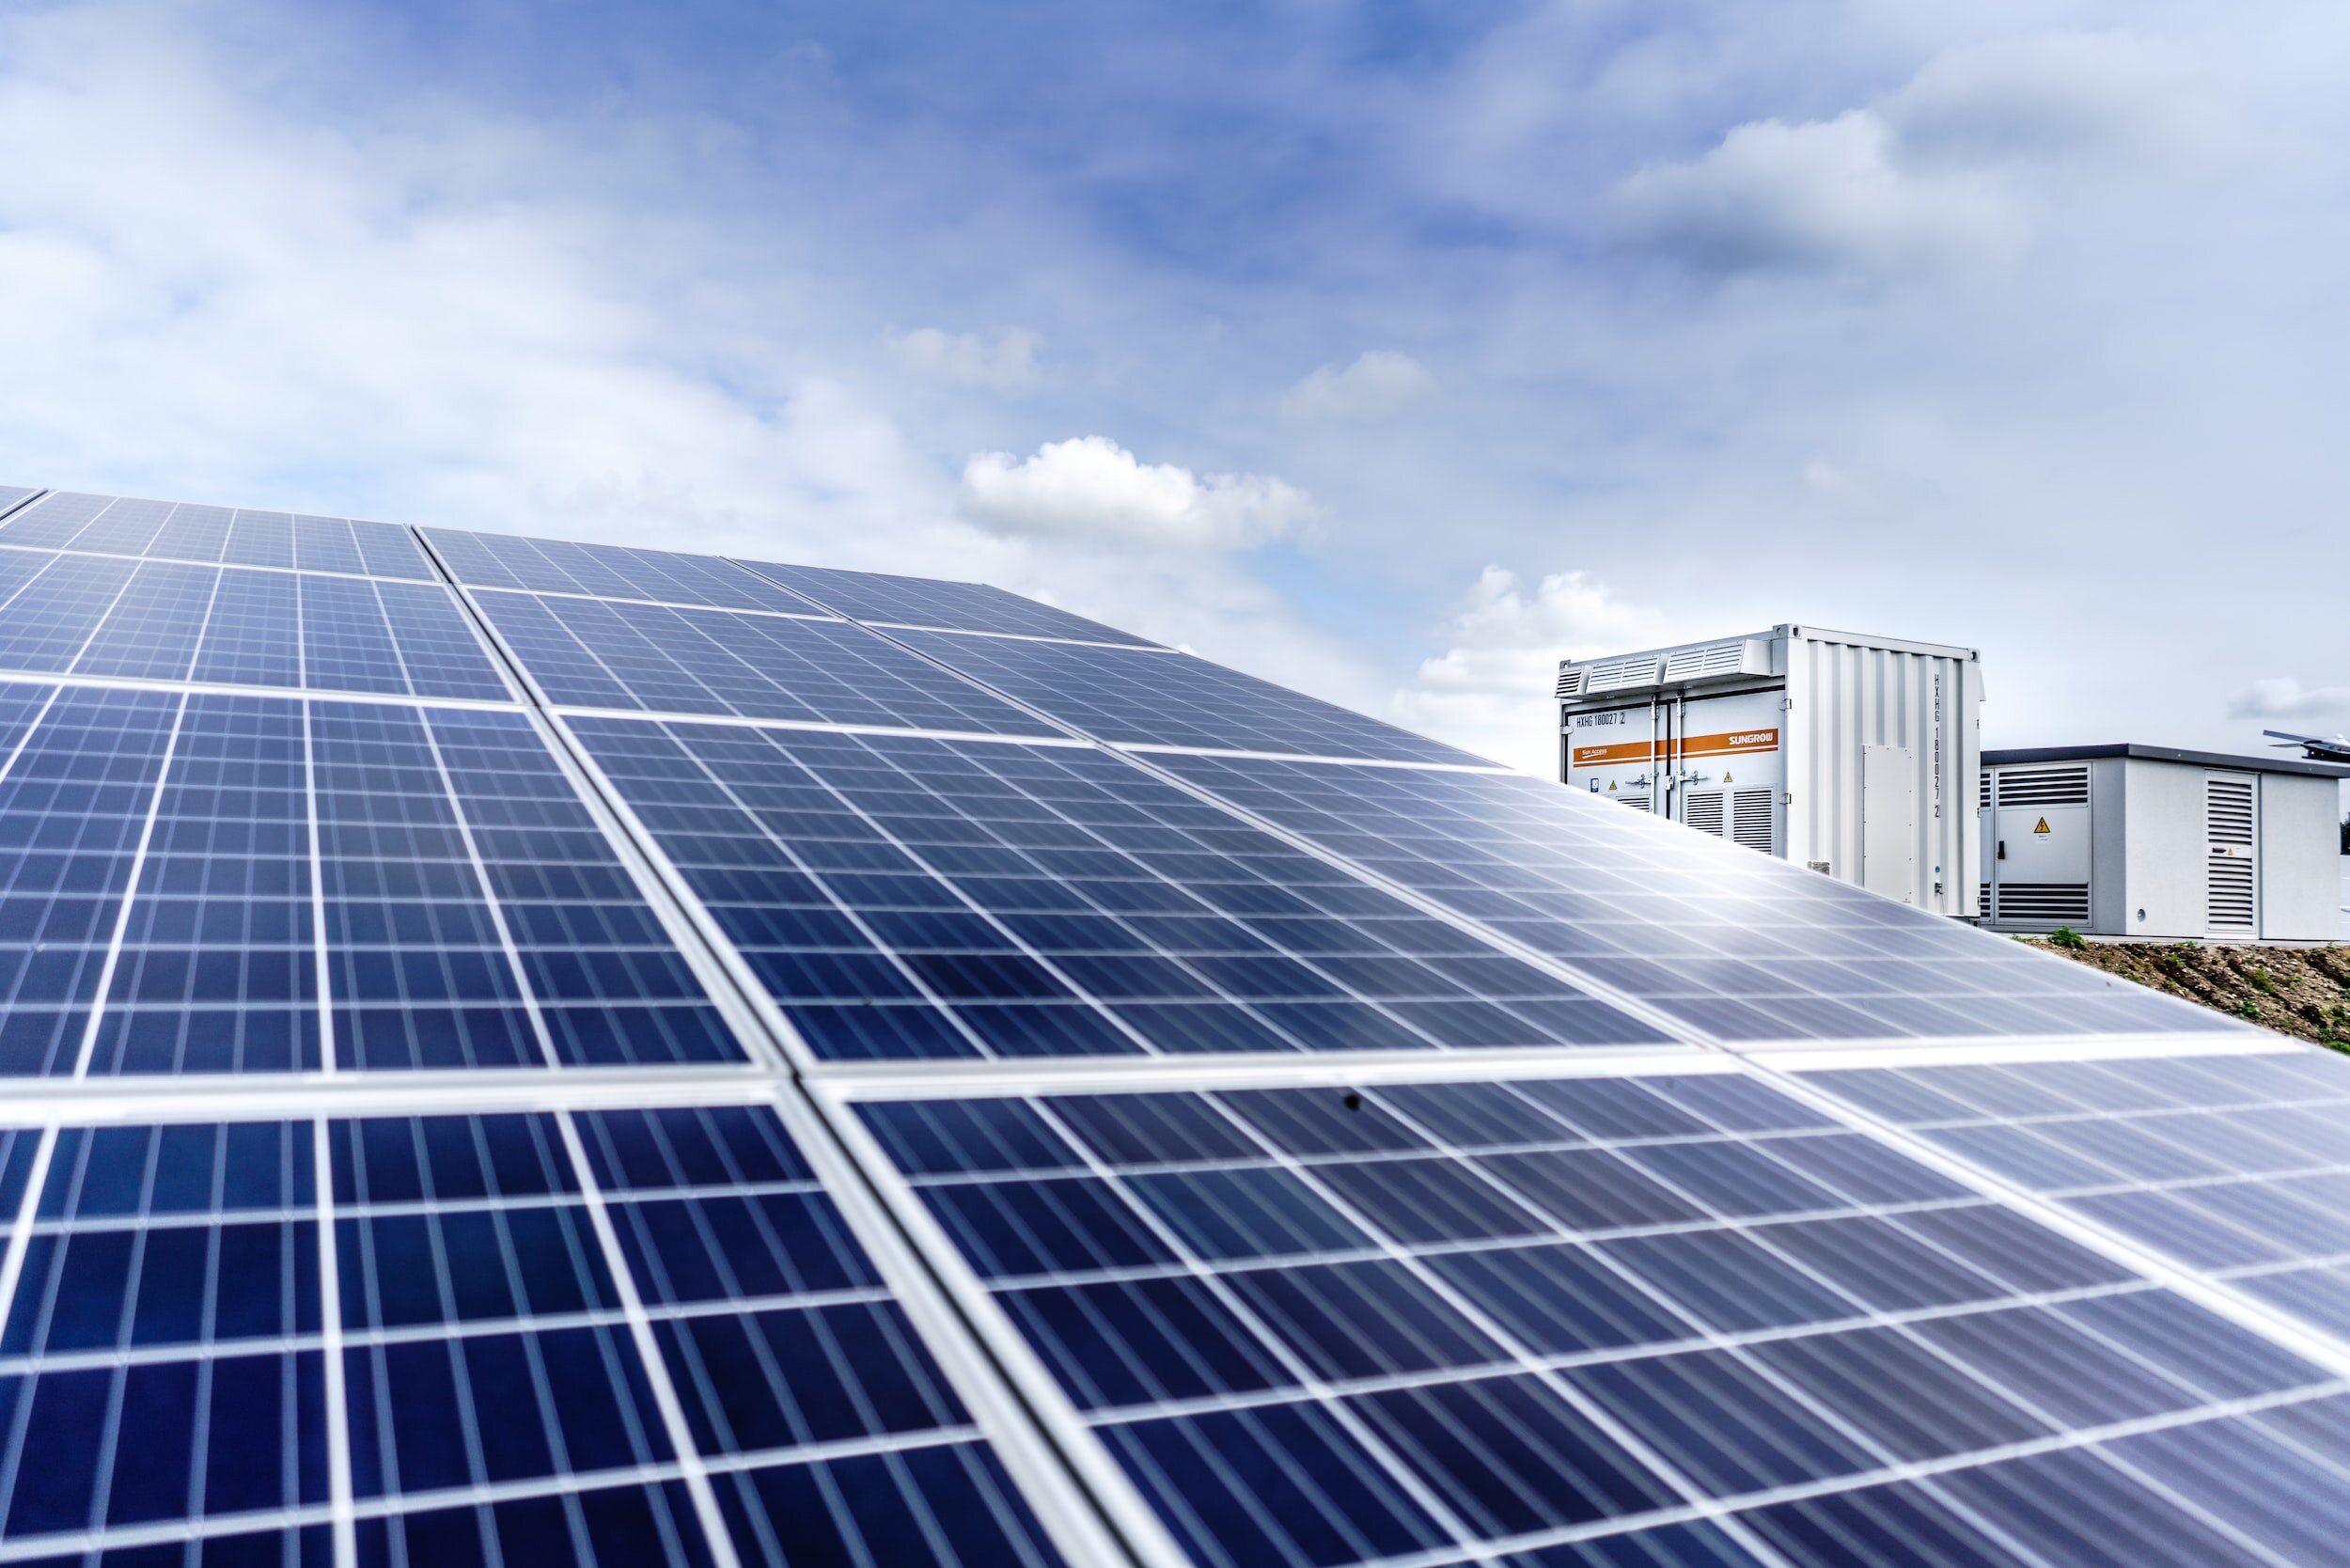
Across the University, 44 buildings have solar systems installed, equating to over 11,000 PV panels. These panels generate more than 3000 MWh of clean energy for our campuses each year.
This is equivalent to powering 650 houses for a year, and prevents around 3000 tonnes of carbon from being released into our atmosphere.
Greenhouse gas emissions
We are committed to understanding and addressing the full scale of our carbon emissions. In 2022, the University commissioned carbon and energy management specialists, Pangolin Associates, to provide a comprehensive, Climate Active compliant greenhouse gas inventory (GHGI) covering our direct and indirect emissions. For the first time, this encompassed a review of our entire procurement expenditure of over $1 billion across all purchasing categories. As a result, our reported indirect (or scope 3) emissions include categories previously unreported, such as professional services; and products, materials and equipment. Emissions from these categories have been estimated based on the amount of money spent in each category. Explore the data for Scope 3 emissions by category.
Emissions from construction and capital works have also been included in the GHGI. Using the material life cycle analyses (LCAs) undertaken for the Student Precinct Project’s Student Pavilion and Arts and Cultural Building on Parkville campus, we piloted an approach for accounting for the upfront carbon of construction projects. The balance of our construction emissions was then estimated using procurement expenditure data. This comprehensive process has enabled us to understand our baseline emissions across all categories, as we work towards the goal of carbon neutrality by 2025.
Scope 1 (or direct) emissions are primarily generated from use of natural gas for heating and hot water. To reduce these emissions, we are developing a program to replace gas infrastructure with equipment that uses electricity. Building on an audit of our Parkville natural gas infrastructure, conducted by consultants in 2021, a prioritisation matrix was created to help plan the replacement of the extensive gas assets owned by the University. Due to the complexity of many of these projects, including a number of ‘heating precincts’ where a gas boiler services several buildings across a large area, this program is expected to be rolled out over the next decade, with high-impact projects prioritised. In 2022, the University undertook a number of pilot projects, including the replacement of 13 gas-fired domestic hot water units across 10 buildings with electric heat pumps, and scoping a project to fully electrify the Burnley campus. We will continue to develop and roll out our long-term electrification program in 2023.
We achieved zero net emissions from electricity for the second year in 2022. By voluntarily retiring 49,575 renewable energy certificates (LGCs), sourced primarily from our wind farm Power Purchase Agreements (PPAs), we ensured that 64 per cent of our total electricity consumption was from renewable sources. Residual emissions from electricity for 2022 totalled approximately 39,000 tCO2-e, which were offset by purchasing a portfolio of carbon offsets, as shown in the Purchased Carbon Offsets and Allocation table.
Carbon emissions from business flights increased from less than 1,000 tCO2-e in 2021 to 15,581 tCO2-e in 2022. While this is still over 40 per cent lower than pre-pandemic levels in 2019, we expect flights to increase further in 2023 as travel continues to rebound. Carbon emissions from flights were fully offset (see Greenhouse Gas Emissions table). Our vehicle fleet generated carbon emissions of 315 tCO2-e, which was more than was offset by the purchase of 754 tCO2-e of carbon offsets from Greenfleet. These offsets directly fund native reforestation projects around Australia. Greenfleet offsets are not Climate Active certified, hence they are not included in our GHGI.

Greenhouse gas emissions by scope


Staff commuting patterns
We conducted a staff survey on commuting and working from home (WFH) habits in 2022, to enable us to estimate emissions from these activities, determine the sustainability of current commuting practices, and direct our efforts to encourage more sustainable modes of transport. Over 1900 staff members participated in the survey, providing 644 suggestions to support active transport on campus.
This was the first time that staff WFH patterns were included in the survey, reflecting how the pandemic has changed our ways of working. The emissions associated with WFH were estimated at 2,313 tCO₂-e for 2022.
The survey revealed that the overall volume of greenhouse gas emissions from staff commuting has increased since the last survey in 2019. This is the result of significantly more staff commuting by car than before the pandemic. Other more sustainable modes of commuting, such as public transport, have declined correspondingly. We anticipate emissions from commuting by car to reduce somewhat in 2023, as we return to normal travel patterns. As part of our efforts to support sustainable transport, we have initiated development of an electric vehicle (EV) fleet strategy and EV infrastructure strategy in 2023.
Staff commuting CO2 emissions and distance by transport mode 2019 and 2022


Upgrading cycling infrastructure on our campuses
With an increase in ownership of e-bikes and e-scooters, we are making more secure bike parking spaces available across our campuses. In 2022, we retrofitted a disused space on Grattan Street on the Parkville campus to create a new e-bike and scooter parking and charging station for staff and students.
This new facility provides secure parking and charging for up to 10 e-bikes and 10 e-scooters. We also installed three new bike repair stations and 12 bike hoops on the Werribee, Creswick and Dookie campuses to provide more facilities for active transport users at our regional campuses.